Naar inhoud springen

Bestand:Illustration of causal and non-causal filters.svg

Pagina-inhoud wordt niet ondersteund in andere talen.
Uit Wikivoyage

Oorspronkelijk bestand(SVG-bestand, nominaal 688 × 621 pixels, bestandsgrootte: 65 kB)

Beschrijving

Beschrijving
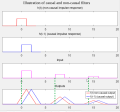
English: Each component of the causal filter output begins when its stimulus begins. The outputs of the non-causal filter begin before the stimulus begins.
Datum (UTC)
Bron Dit bestand is afgeleid van: Illustration of causal and non-causal filters.png
Auteur Bob K
Toestemming
(Hergebruik van dit bestand)
Ik, de auteursrechthebbende van dit werk, maak het hierbij onder de volgende licentie beschikbaar:
Creative Commons CC-Zero Dit bestand is beschikbaar onder Creative Commons CC0 1.0 Universele Public Domain Dedication.
De persoon die een werk voorziet van deze licentie stelt dit werk beschikbaar aan het publieke domein door, voor zover dit wettelijk is toegestaan, afstand te doen van alle rechten op het werk in de zin van het auteursrecht, met inbegrip van alle aanverwante of naburige rechten. U kunt het werk kopiëren, aanpassen, distribueren en uitvoeren, ook voor commerciële doeleinden, zonder dat u daarvoor toestemming hoeft te vragen.

SVG ontwikkeling
InfoField
 
De broncode van dit SVG-bestand is niet deugdelijk vanwege 3 fouten.
 
Deze niet W3C-deugdelijke vectorafbeelding is gemaakt met LibreOffice
Gnu Octave source
InfoField
click to expand

This graphic was created with the help of the following Octave script:

% Options
  frame_background_gray = true;

  if frame_background_gray
   graphics_toolkit("qt")         % has "insert text" option
%  graphics_toolkit("fltk")       % has cursor coordinate readout
   frame_background = .94*[1 1 1];
   d  = 4;                         % amount to add to text sizes
  else
   graphics_toolkit("gnuplot")    % background will be white regardless of value below
   frame_background = .94*[1 1 1];
   d=0;
  endif
  
  xmax = 1000;                    % length of plots
  L    = 100;                     % length of rectangles

% (https://octave.org/doc/v4.2.1/Graphics-Object-Properties.html#Graphics-Object-Properties)
% Speed things up when using Gnuplot
  set(0, "DefaultFigureColor",frame_background)
  set(0, "DefaultAxesTitleFontweight","normal")
  set(0, "DefaultAxesFontsize",12+d)   % size of numeric tick labels
% set(0, "DefaultTextFontsize",12+d)
  set(0, "DefaultAxesYlim",[0 2])
  set(0, "DefaultAxesXlim",0.02*([-200 xmax]))
  set(0, "DefaultAxesYtick",[])
  set(0, "DefaultLineLinewidth",2)

%=======================================================
  hfig = figure("position",[1 -150 735 835]);

  x1 = .02;                     % left margin
  x2 = .02;                     % right margin
  y1 = .08;                     % bottom margin for annotation
  y2 = .10;                     % top margin for title
  dy = .10;                     % vertical space between rows

  width = 1-x1-x2;
  height= (1-y1-y2-3*dy)/4;     % space allocated for each of 4 rows

  x_origin = x1;
  y_origin = 1;                 % start at top of graph area
%=======================================================
  y_origin = y_origin -y2 -height;        % position of top row
  subplot("position",[x_origin y_origin width height])

  f = [zeros(1,200) ones(1,L) zeros(1,100)];

  plot(0.02*([1:length(f)]-250), f ,"r" )
  title("h(t) (non-causal impulse response)", "fontsize",14+d)

%=======================================================
  y_origin = y_origin -dy -height;
  subplot("position",[x_origin y_origin width height])
  plot(0.02*([1:length(f)]-200), f, "b" )
  title("h(t-1) (causal impulse response)", "fontsize",14+d)

%=======================================================
  y_origin = y_origin -dy -height;
  subplot("position",[x_origin y_origin width height])
  a = [zeros(1,200) ones(1,L) zeros(1,250) 0.5*ones(1,100) zeros(1,250) 0.25*ones(1,100) zeros(1,200)];
  plot(0.02*([1:length(a)]-200), a,"m")
  ylim([0 2*max(a)])
  title("Input", "fontsize",14+d)

%=======================================================
  y_origin = y_origin -dy -height;
  subplot("position",[x_origin y_origin width height])
  b = conv(a,f);
  c = b(200:end);
  plot(0.02*([1:length(c)]-250), c, "r", 0.02*([1:length(c)]-200), c, "b")
  ylim([0 max(b)])
  legend("f(t) non-causal output", "f(t-1) (causal output)")
  title("Outputs", "fontsize",14+d)

 print -dsvg Illustration_of_causal_and_non-causal_filters.svg

Oorspronkelijk uploadlogboek

This image is a derivative work of the following images:

  • File:Illustration_of_causal_and_non-causal_filters.png licensed with PD-user
    • 2012-01-07T02:20:59Z OgreBot 1470x1671 (32150 Bytes) (BOT): Reverting to most recent version before archival
    • 2012-01-07T02:20:55Z OgreBot 483x585 (6466 Bytes) (BOT): Uploading old version of file from en.wikipedia; originally uploaded on 2005-12-12 00:25:17 by [[:en:User:Bob K|Bob K]]
    • 2012-01-07T02:20:53Z OgreBot 441x659 (5782 Bytes) (BOT): Uploading old version of file from en.wikipedia; originally uploaded on 2005-12-11 23:47:49 by [[:en:User:Bob K|Bob K]]
    • 2012-01-07T02:20:51Z OgreBot 429x635 (5727 Bytes) (BOT): Uploading old version of file from en.wikipedia; originally uploaded on 2005-12-11 23:34:00 by [[:en:User:Bob K|Bob K]]
    • 2012-01-06T13:35:34Z Bob K 1470x1671 (32150 Bytes) {{BotMoveToCommons|en.wikipedia|year={{subst:CURRENTYEAR}}|month={{subst:CURRENTMONTHNAME}}|day={{subst:CURRENTDAY}}}} The upload bot is [[User:CommonsHelper2 Bot]] which is called by [http://toolserver.org/~commonshelper2/in

Bijschriften

Beschrijf in één regel wat dit bestand voorstelt

Items getoond in dit bestand

beeldt af

image/svg+xml

Bestandsgeschiedenis

Klik op een datum/tijd om het bestand te zien zoals het destijds was.

Datum/tijdMiniatuurAfmetingenGebruikerOpmerking
huidige versie2 feb 2020 10:52Miniatuurafbeelding voor de versie van 2 feb 2020 10:52688 × 621 (65 kB)Bob Kminor cleanup
1 feb 2020 21:06Miniatuurafbeelding voor de versie van 1 feb 2020 21:06688 × 642 (66 kB)Bob Kchange frame background from white to gray
7 aug 2012 19:39Miniatuurafbeelding voor de versie van 7 aug 2012 19:39512 × 579 (107 kB)Zerodamage== {{int:filedesc}} == {{Information |Description={{en|Each component of the causal filter output begins when its stimulus begins. The outputs of the non-causal filter begin before the stimulus begins}} |Source={{Derived from|Illustration_of_causal_and...

Geen enkele pagina gebruikt dit bestand.

Globaal bestandsgebruik

De volgende andere wiki's gebruiken dit bestand:

Metadata